Module 6: Makers and Checkers
MGMT 675: Generative AI for Finance
From Makers to Checkers
What we’re working towards is that every employee will have their own personalized AI assistant; every process is powered by AI agents, and every client experience has an AI concierge.
Workers would shift from being creators of reports or software updates, or ‘makers’ … to ‘“checkers” or managers of AI agents’ doing that work.
Derek Waldron, JP Morgan Chief Analytics Officer — CNBC interview, September 30, 2025
The Maker
AI as maker is a fast, tireless junior analyst that handles the mechanical work.
What AI Does Well
- Drafts reports, memos, and summaries
- Wrangles and merges data from multiple sources
- Builds spreadsheets with live formulas
- Runs calculations and generates charts
- Formats output to a professional standard
The Speed Advantage
- Tasks that take hours become minutes
- No fatigue, no context-switching cost
- Runs the same workflow identically every time
- Frees you for judgment, relationships, and strategy
The Checker
Your role shifts from doing the work to directing and verifying it.
Directing
- Specify the task clearly
- Provide the right inputs and context
- Define what “good output” looks like
- Decide when to iterate vs. accept
Verifying
- Spot-check key numbers against known sources
- Confirm the logic matches the business question
- Review edge cases and assumptions
- Sign off before the output goes anywhere consequential
The checker adds the judgment the maker lacks. Neither alone is enough.
Where AI Can Silently Fail
Silent Analytical Errors
AI in code-execution mode rarely invents facts outright. Instead it makes silent analytical errors — mistakes that look fine on the surface.
Common Failure Modes
- Filters slightly off (wrong date range, wrong column)
- Missing data dropped without warning
- Aggregation in the wrong order
- Misread assumptions from an ambiguous prompt
- Made-up citations or statistics in prose
Why They’re Dangerous
- Output looks polished and professional
- Charts render cleanly — nobody questions a clean chart
- Errors compound silently in multi-step workflows
- Confidence without verification is the real risk
The Checker’s Toolkit
You don’t need to re-do the work. You need targeted verification.
- Spot-check with known answers — run a simplified version of the calculation by hand on one or two rows
- Ask Claude to explain its logic — “Walk me through how you computed this number”
- Review the code — ask Claude to show the key filter and aggregation steps
- Test edge cases — what happens with zeros, negatives, or missing values?
- Sanity-check the magnitude — does the answer make sense given what you know?
Pick the checks that match the stakes. A quick directional analysis needs less verification than a client deliverable.
Packaging the Maker as a Skill
Why Build a Skill?
Once you have a workflow that works and passes your checks, turn it into a skill — a reusable, one-command process.
Without a Skill
- Re-type or copy-paste the same prompt each time
- Risk of drift — slightly different wording, slightly different output
- Others on your team can’t easily reuse your work
With a Skill
- One
/commandruns the full workflow - Same logic, same checks, same output format every time
- Shareable — drop it in a shared
skills/folder
A skill is how a one-time workflow becomes a team asset.
Building a Skill with /skill-creator
- Type
/skill-creatorto start the skill builder - Describe the workflow: inputs, steps, outputs, and any checks to include
- Claude generates a
SKILL.mdand installs it in~/.claude/skills/ - Invoke it anytime with
/skill-name
You can embed checker steps directly in the skill — for example, “after computing the result, show the row count and the min/max values so the user can sanity-check the data.”
Valuing Companies
Valuation by Multiples
Compare the target company to similar public companies on industry and size, then apply their valuation multiples.
Finding Comparables
- Match on industry (same SIC code or GICS sector)
- Match on size (revenue, market cap, or total assets)
- The closer the match, the more reliable the multiple
Common Multiples
- P/E — price to earnings; most widely used
- P/S — price to sales; useful when earnings are negative
- P/B — price to book; common in financial firms
For full automation, connect the agent to a database of public company financials — it can pull comparables, compute medians, and apply multiples in one step.
Two-Stage DCF Analysis
Discount projected cash flows back to the present. Two stages handle near-term uncertainty and long-run stability separately.
Stage 1: Year-by-Year Forecasts
- Explicitly forecast each year (typically 5–10 years)
- Forecast key financial ratios and growth rates
- Example: forecast sales growth, then derive everything else in relation to sales
Stage 2: Terminal Value
- After the explicit forecast period, assume constant growth forever
- Terminal value = final year cash flow × (1 + g) / (r − g)
- Often represents 60–80% of total value — the checker’s most important number to scrutinize
Getting Started
Ask Claude Code:
Create an Excel workbook illustrating a two-stage DCF model for a company. Forecast cash flows building up from forecasts of key financial ratios and growth rates.
Gotcha 1
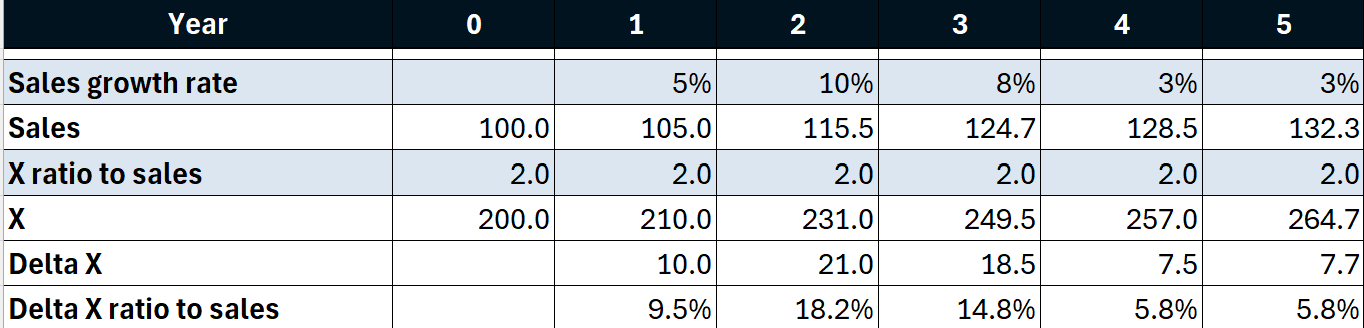
- It is reasonable to forecast balance sheet items in proportion to sales: receivables/sales, inventory/sales, net PP&E/sales, …
- The change in a balance sheet item depends on the ratios in two successive years
- Outside of constant growth, compute the change — don’t forecast it as a proportion of sales
- For cap ex: forecast net PP&E as a proportion of sales, forecast depreciation as a percent of net PP&E, calculate cap ex as the plug
Gotcha 1 Example
X = any balance sheet item: receivables, payables, net PP&E, …
Gotcha 2
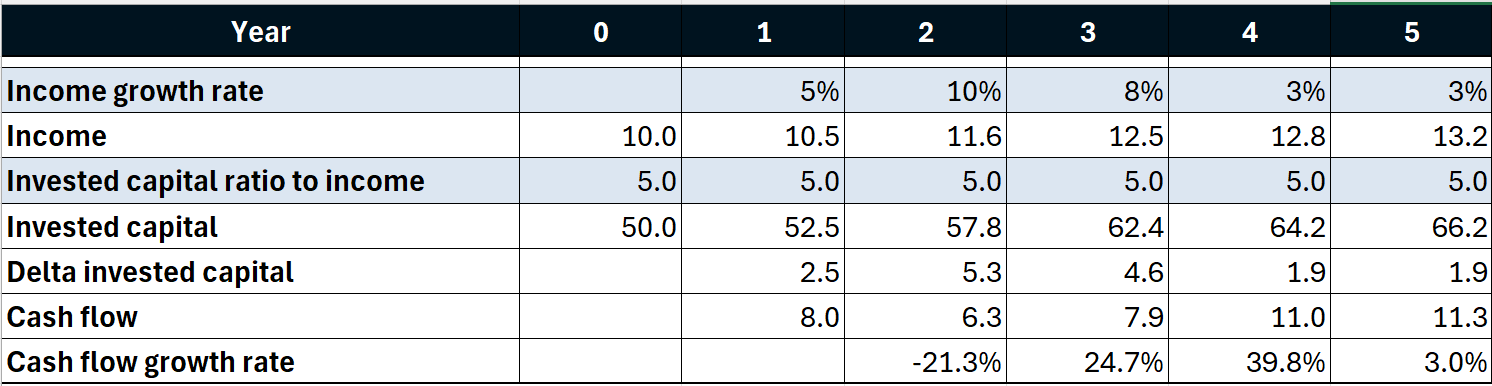
Because changes in balance sheet items depend on sales growth in two successive years, the first year of constant cash flow growth is the second year of constant sales growth.
Bottom line: Add the first year of constant sales growth to Stage 1. Make that year the terminal year.
Gotcha 2 Example
Constant cash-flow growth begins in year 5 (the second year of constant income growth).
So year 4 (the first year of constant income growth) should be the terminal year of the 1st stage.
Or you can use year 5, year 6, … as the terminal year. It doesn’t matter. Just include at least the first year of constant income growth as part of Stage 1.
2-Stage DCF Skill
- Type
/skill-creatorto start the skill builder - Ask Claude to create a
2-stage-dcfskill - Include the gotcha rules in your prompt — copy and paste or type them in.
/skill-creator I want a 2-stage-dcf skill that use your xlsx skill to generate a two-stage DCF analysis. I want these rules to be followed …
Valuing Walmart 2010
Outline
- Provide baseline assumptions to Claude
- Ask Claude for 2-stage DCF analysis
- Ask Claude for sensitivity analysis
- Ask Claude for a Word doc with tables and analysis
- Ask Claude for a PowerPoint deck
Income Statement
- Sales growth?
- COGS % of sales?
- SG&A % of sales?
- Income tax % of income?
- What to do about other income, discontinued operations, minority interest?
Start by computing historical growth and percentages (or ask Claude to do it).
Balance Sheet
- Items as % of sales. What percents?
- What to do about cash, discontinued operations, capital leases, goodwill, other assets?
Calculating Free Cash Flow
- Net income (ignoring interest)
- Change in NWC
- Depreciation add-back
- Calculate cap ex as plug
- Changes in other assets, goodwill?
Use Claude
Tell Claude what you’ve chosen as baseline assumptions (including WACC) and ask for a two-stage DCF analysis.
/2-stage-dcf Read Walmart.xlsx, which contains historical statements. Create a two-stage DCF analysis to value Walmart at the end of 2010 using the following assumptions …
Subsequent Steps
- Sensitivity analysis (in Excel)
- Word doc
- PowerPoint deck
Claude on its Own
Start a new Code session. Tell Claude:
Read Walmart.xlsx, which contains historical statements. Formulate assumptions and prepare a 2-stage DCF analysis to value Walmart at the end of 2010. Create a Word doc containing results and discussion.
Collaborating with Claude
Start another new Code session. Tell Claude:
Read Walmart.xlsx, which contains historical statements. I need to create a 2-stage DCF analysis to value Walmart at the end of 2010, and I want your help. How should we get started?